
One of the most common questions after a slurry pump installation is simple: "Why is the pump not performing the way the curve said it would?"
In many cases, the pump is not defective and the curve is not wrong. The issue that most published pump curves are based on clean-water testing under controlled conditions. Slurry applications are different. Once abrasive solids, higher density, particle size variation, pipeline friction, elevation changes, and wear are introduced, actual field performance can shift significantly from the published curve.

A pump curve is a valuable starting point, but it is not a complete prediction of slurry system performance. For dredging, mining, tailings, wastewater, and industrial high-solids applications, buyers need to evaluate the pump curve together with the system curve, slurry characteristics, pipeline layout, and long-term wear conditions.
What Does a Surry Pump Curve Actually Tell You?
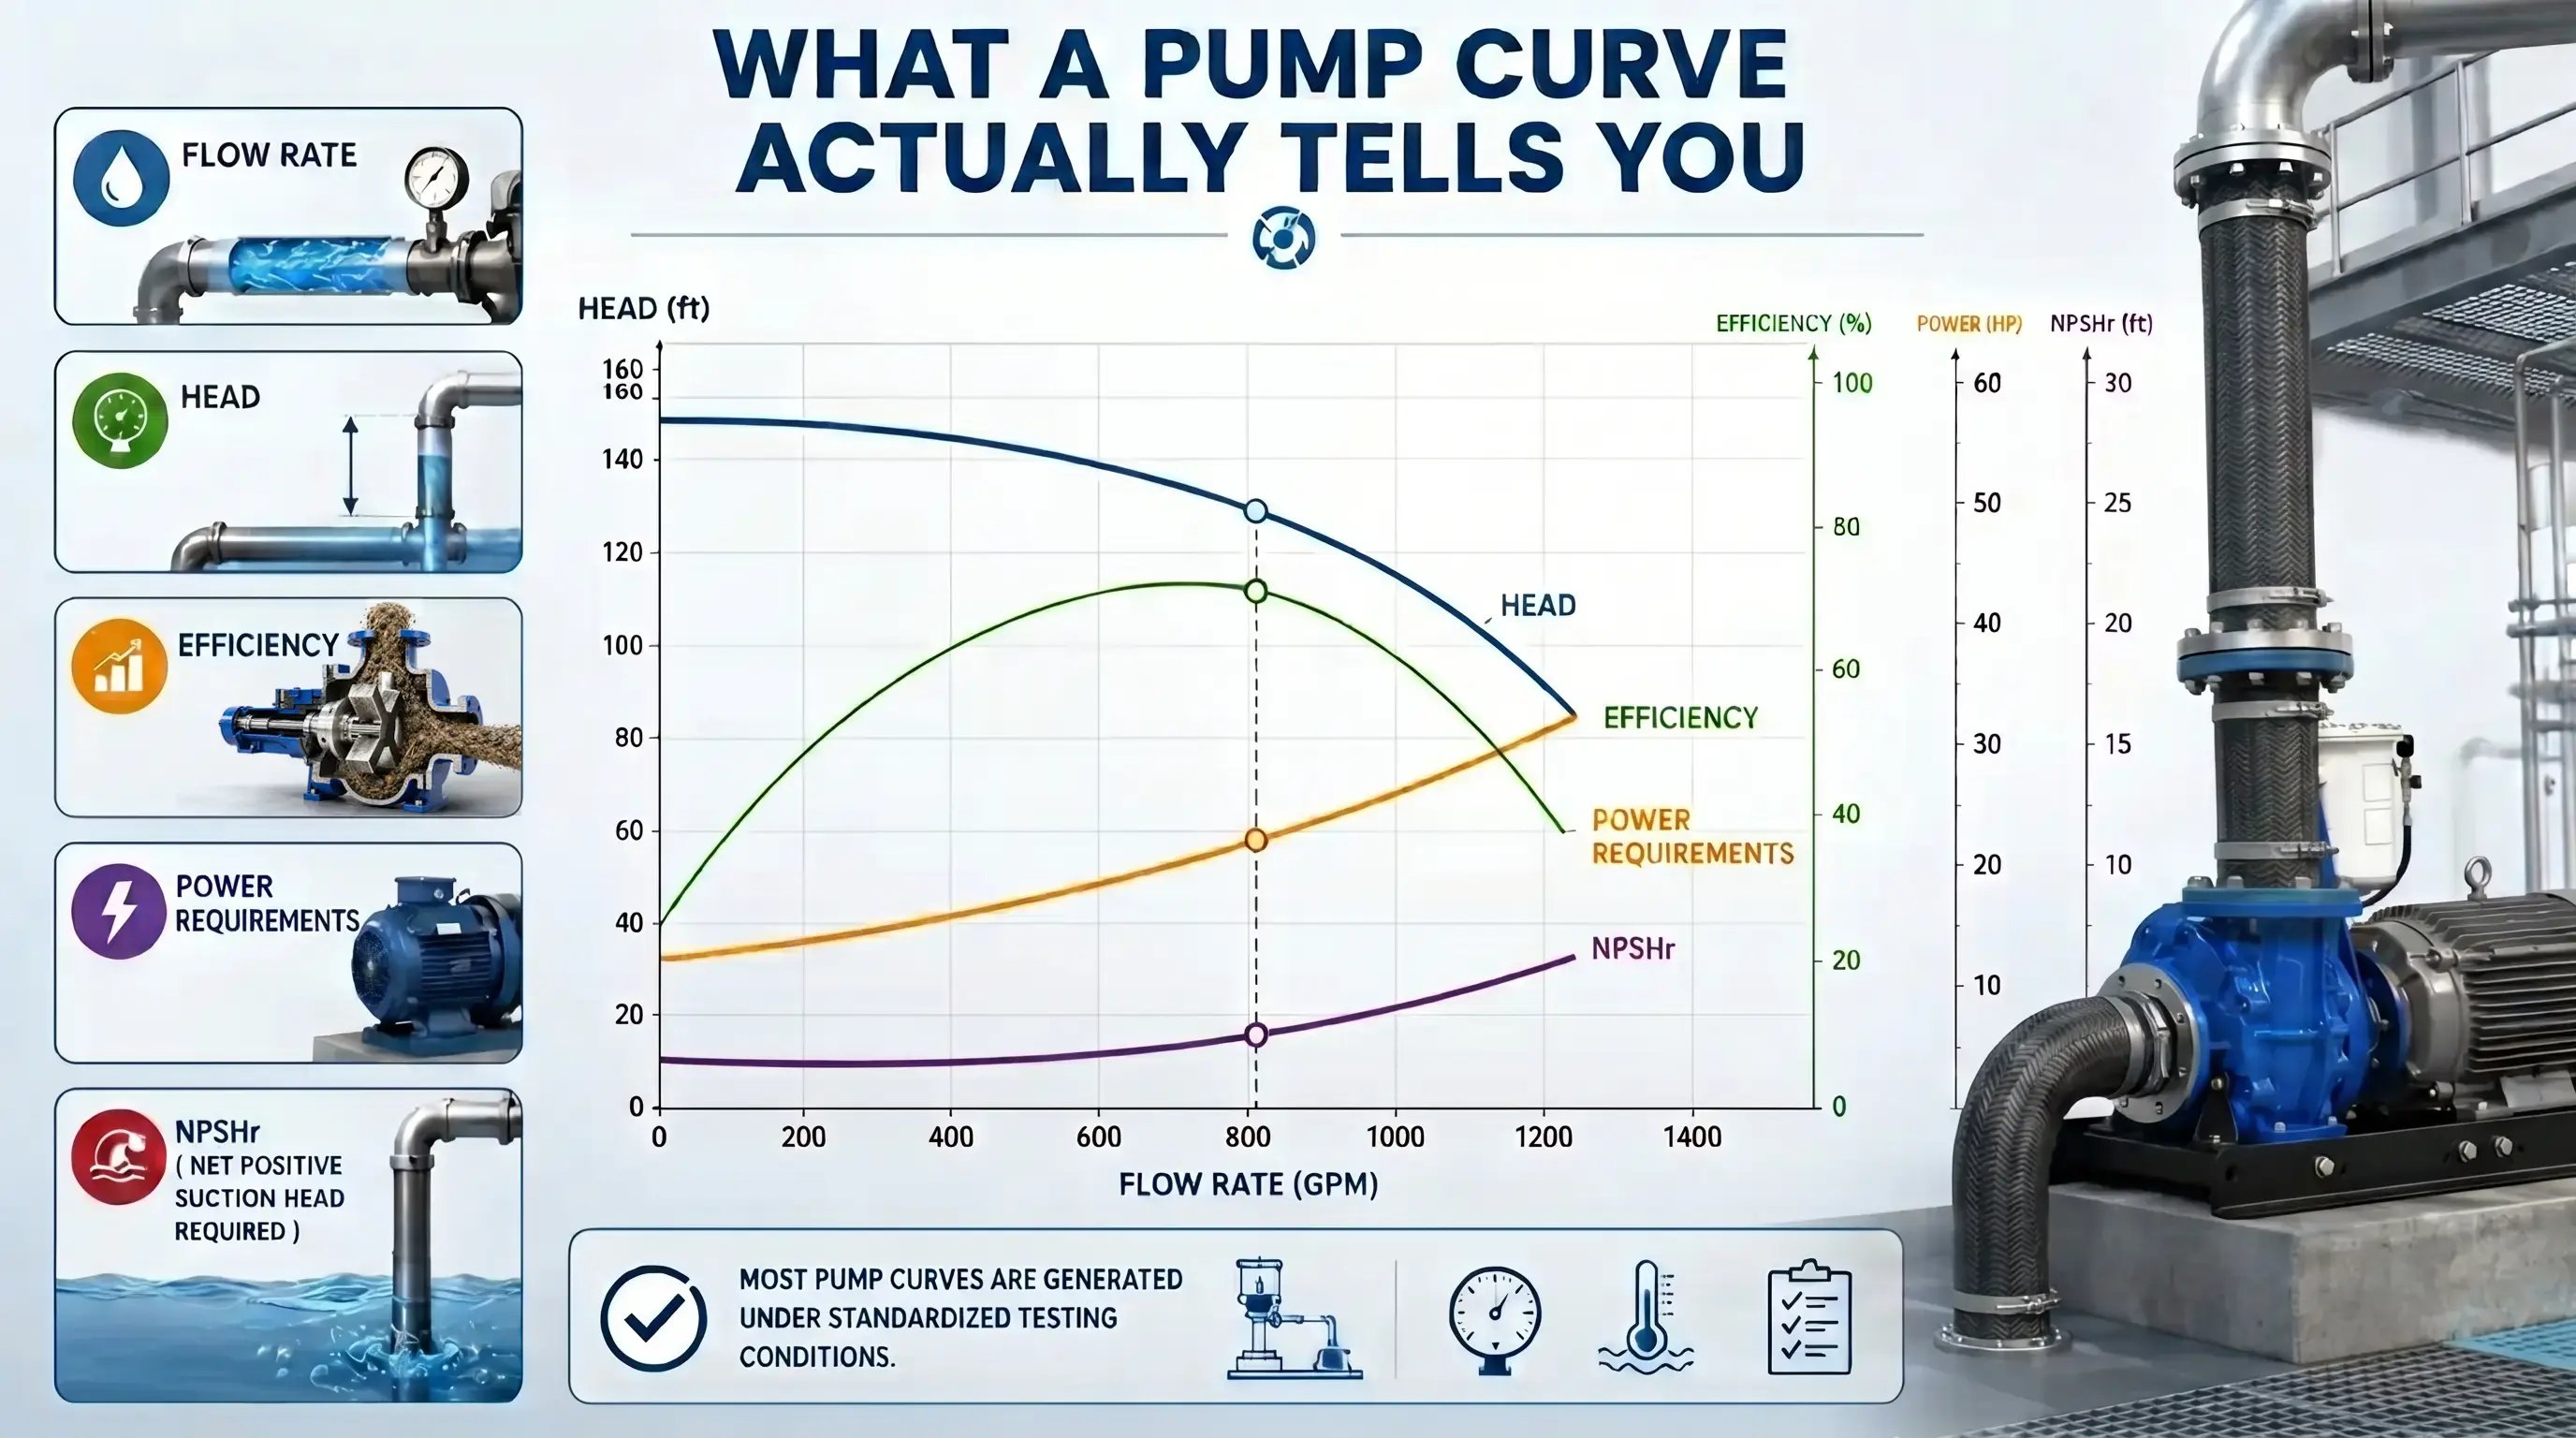
A slurry pump curve shows how a pump performs under defined test conditions, usually with clean water. It helps estimate flow, head, efficiency, power and NPSH requirements, but it does not actually predict field performance in abrasive or high-solids slurry.
To evaluate real performance, buyers also need slurry data, pipeline layout, system curve analysis, wear expectations, and slurry correction factors. That is why a pump curve should be treated as one part of the selection process, not the final answer.
The Most Common Pump Performance Complaint
A project team selects a pump using the manufacturer’s published curve. The system is installed, startup procedures are followed, and the equipment appears to match the design requirements. Then the pump begins moving slurry, and the real-world numbers do not match expectations.
The actual flow rate may be lower than projected. Discharge pressure may differ from the design point. Power consumption may be higher than expected. Operators may assume the pump is the problem, but in many slurry systems the larger issue is that the application does not behave like the clean-water test conditions used to create the curve.
Understanding that difference is essential for accurate slurry pump selection, troubleshooting, and long-term system reliability.
What a Pump Curve Actually Shows
A pump curve is one of the most important tools used when selecting and evaluating a pump. It provides a graphical representation of how a pump is expected to perform at different operating conditions.
The key information found on a typical pump curve includes:
- Flow Rate – The volume of fluid the pump can move over a specific period, usually expressed in gallons per minute (GPM) or cubic meters per hour.
- Head – The amount of energy the pump adds to the fluid, commonly expressed as feet or meters of head.
- Efficiency – The percentage of input energy converted into useful hydraulic energy.
- Power Requirements – The amount of horsepower or kilowatts required at various operating points.
- NPSHr (Net Positive Suction Head Required) – The minimum suction pressure needed to prevent cavitation inside the pump.
|
Pump Curve Parameter |
Typical Testing Condition |
|
Fluid |
Water |
|
Specific Gravity |
1.0 |
|
Viscosity |
Water-like |
|
Solids Content |
None |
|
Test Environment |
Controlled laboratory conditions |
These conditions create a consistent baseline for measuring pump performance. They are useful for comparing pumps, but they rarely reflect the realities of industrial transport.
A pump curve is not wrong. It simply describes how the pump performs under a specific set of test conditions. The challenge begins when the actual application differs significantly from those conditions .
Why Slurry Changes Everything
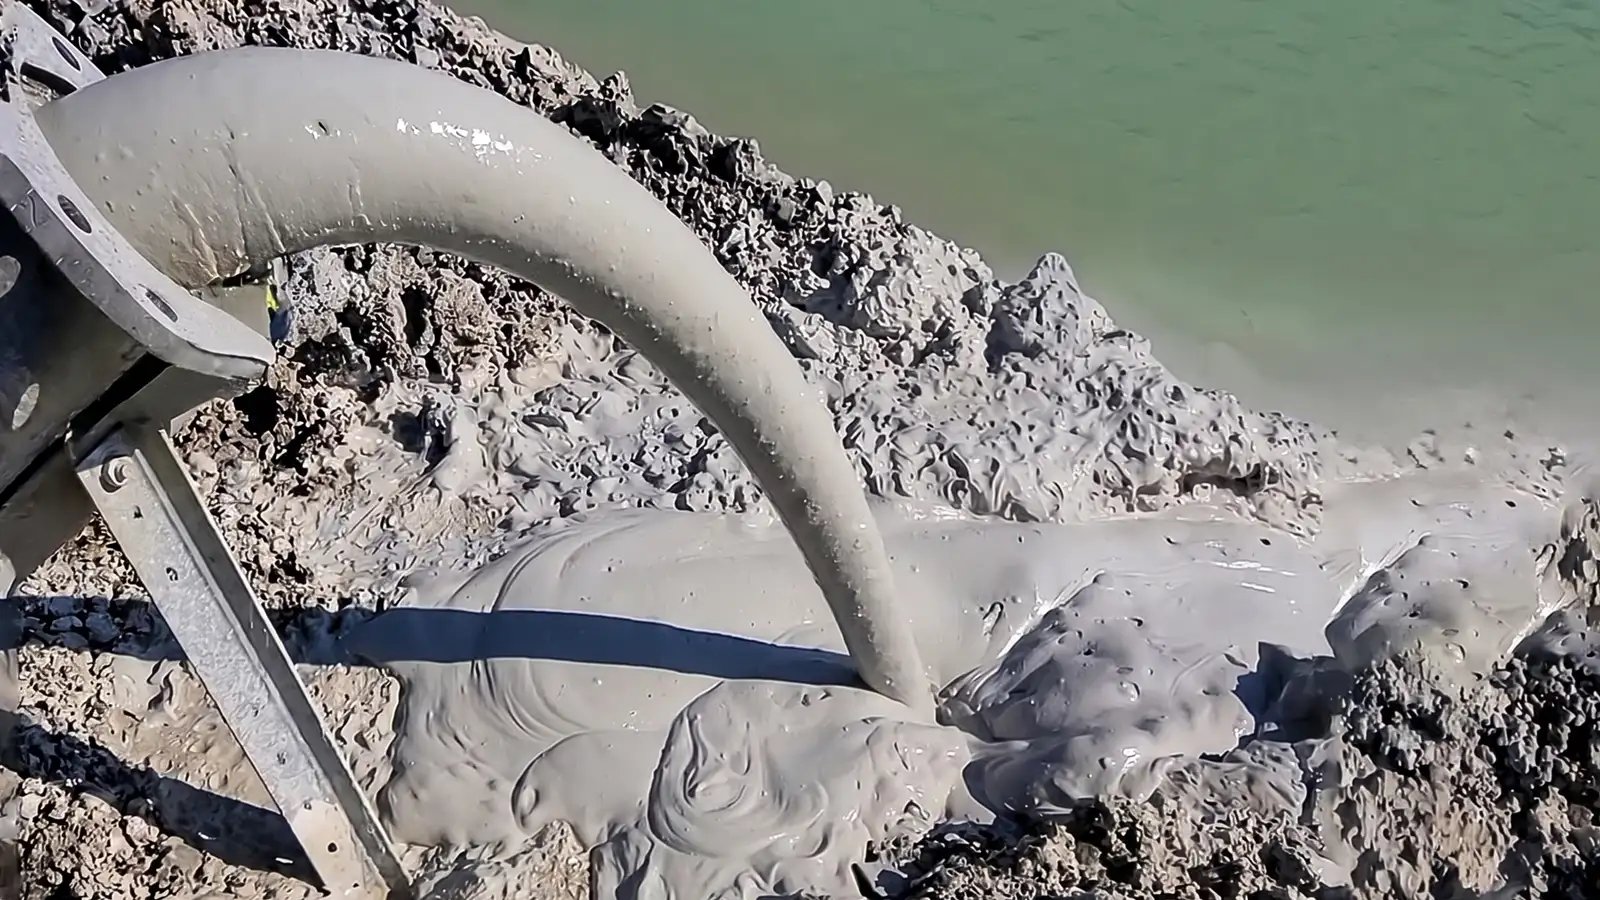
Slurry does not behave like water. Water is relatively predictable. Slurry contains suspended solids that change density, viscosity, friction losses, wear behavior, and transport requirements. .
Even when the pump speed remains unchanged, the fluid being transported can create an entirely different hydraulic environment. A pump that performs as expected with clean water may operate very differently when moving dense mining tailings, dredged sediment, ash pond material, wastewater sludge, or other high-solids mixtures.
This matters because a pump may appear properly sized on paper but still struggle in the field if the actual slurry is denser, more abrasive, or harder to transport than expected. The result may be lower flow, higher power draw, pipeline settling, frequent clogging, accelerated wear, or shorter maintenance intervals.
Why This Matters in High-Solids Slurry Applications
In clean-water pumping, a pump curve can often provide a reliable baseline for expected performance. In slurry applications, the pump must move a heavier, more abrasive, and less predictable material through the system. That changes the real operating conditions.
The better question is not only, “Can this pump hit the curve?” The better question is, “Can this pump maintain reliable performance in this specific slurry system over time?”
For dredging, mining, tailings handling, wastewater, ash ponds, and industrial solids transfer, that question is far more useful than evaluating flow and head alone.
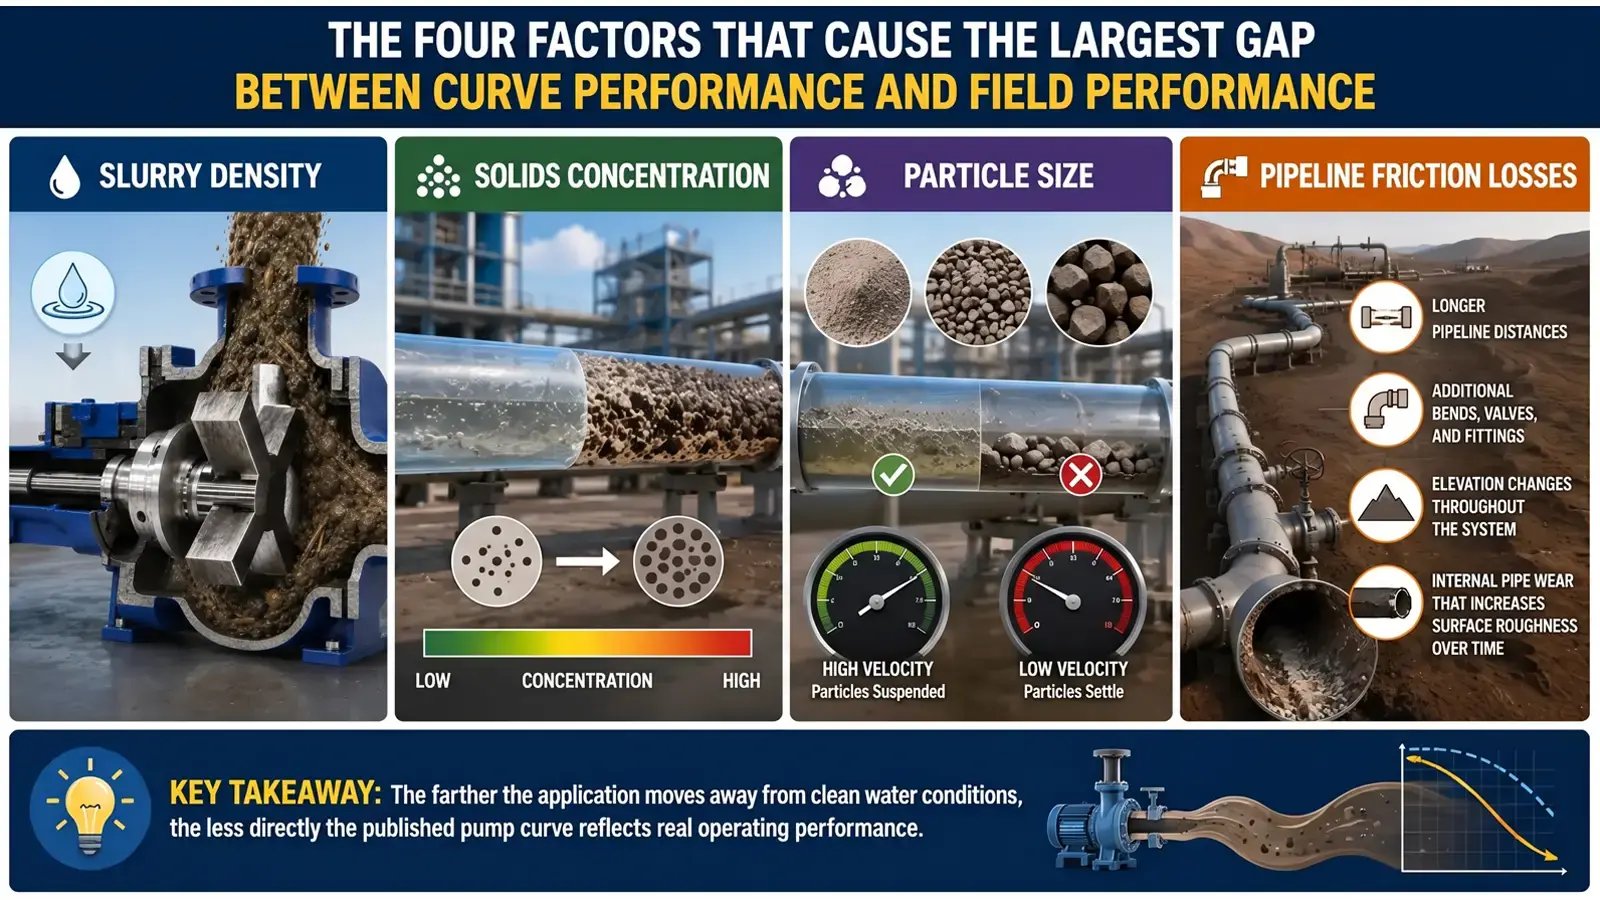
The Four Factors That Cause the Largest Gap Between Curve Performance and Field Performance
When a slurry pump fails to achieve the flow rate, head, or efficiency predicted by its published pump curve, the cause is often not the pump itself. In most cases, one or more application variables are altering system performance. Four factors account for the majority of the gap between water-based curve predictions and actual field results.
Slurry Density
Pump curves are typically generated using water with a specific gravity of 1.0. Slurries often have a higher specific gravity because they contain suspended solids. As density increases, the pump must move a heavier mixture through the system.
Higher slurry density primarily affects power consumption. The pump may still generate head, but the horsepower required to achieve that performance can increase significantly. If density is not considered during pump selection, operators may encounter overloaded motors, reduced efficiency, or lower-than-expected production rates.
Solids Concentration
Solids concentration is commonly expressed as a percentage by volume or a percentage by weight. Both measurements are useful, but they describe different slurry characteristics and can produce different operating conditions.
As solids concentration increases, slurry becomes harder to transport. The mixture may flow less uniformly, create additional resistance in the pipeline, and require more energy from the pump. Higher solids concentrations can also reduce hydraulic efficiency because more energy is consumed moving solids rather than fluid alone.
Particle Size and Particle Distribution
Not all slurries behave the same way, even when density and solids concentration appear similar. Fine particles often remain suspended more easily. Larger particles may settle if flow velocity drops below the required transport speed.
Most industrial slurries contain a range of particle sizes rather than one uniform material. That particle size distribution affects settling risk, wear rates, pipeline friction, and the required transport velocity.
Pipeline Friction Losses
Many performance issues that look like pump problems are actually system problems. As slurry travels through a pipeline, energy is lost through friction between the fluid, solids, and pipe walls.
Longer pipelines, added bends, elevation changes, valves, fittings, pipe wear, and internal roughness can all increase system resistance. Even a properly selected pump may struggle if actual system losses are higher than expected.
Key takeaway: The farther the application moves away from clean-water conditions, the less directly the published pump curve reflects real operating performance.
The Missing Half of the Equation: Pump Curve vs. System Curve
One reason many slurry pumping projects fail to achieve expected performance is that the pump curve receives far more attention than the system curve.
A pump curve represents what the pump can provide. A system curve represents what the pipeline system requires. The pump generates flow and head, but the system consumes that energy through friction losses, elevation changes, valves, bends, fittings, and slurry transport requirements.
Actual operating performance occurs where the pump curve and system curve intersect. This point is called the operating point. If the system curve changes, the operating point changes too.
|
If you only review… |
You may miss… |
|
Pump curve |
Slurry density, solids concentration, and particle-size impact |
|
Flow and head |
Pipeline friction, elevation changes, and transport velocity requirements |
|
Initial operating point |
Wear progression and performance decline over time |
|
Clean-water data |
Slurry correction factors and derating requirements |
|
Pump specifications |
System curve requirements and real operating conditions |
This relationship explains why the same pump can perform well in one installation and poorly in another. The pump may be identical, but the system rarely is.
A pump curve tells you what the pump can do. A system curve tells you what the application demands. Real-world slurry performance is determined by the interaction between the two.
Common Reasons Pumps Fail to Match Published Performance
When a slurry pump fails to achieve the flow rate, head, or efficiency shown on a published pump curve, the cause is often found in the application rather than the pump itself. Common causes include:
- Slurry density is higher than the original design assumptions.
- Solids concentration increased over time or changes throughout operation.
- Pipeline length changed after the original system design.
- Additional bends, valves, reducers, or fittings were added.
- Internal pipe wear increased roughness and friction losses.
- Operating speed differs from the design speed due to motor, engine, hydraulic, or VFD settings.
- Material characteristics differ from the slurry assumptions used during pump selection.
- The system curve was never calculated or was based on incomplete information.
If one or more of these conditions applies, the difference between expected and actual performance may be caused by system conditions rather than a problem with the pump itself.
If one or more of these conditions applies, the difference between expected and actual performance may be caused by system conditions rather than a problem with the pump itself.
Why Engineers Use Curve Corrections Instead of Raw Pump Curves
Experienced engineers treat a published water-based curve as the starting point for slurry pump selection, not the final answer. Slurry introduces additional losses and operating challenges that must be accounted for before performance expectations are set.
Engineers often apply slurry correction factors to account for changes caused by density, solids concentration, particle size distribution, viscosity, and material behavior. In some projects, hydraulic modeling and site-specific calculations are needed to estimate friction losses, transport velocity, settling risk, and total dynamic head.
The goal is not to predict perfect performance. The goal is to create a more realistic expectation of how the pump, slurry, and pipeline system will behave once installed.
This is especially important in mining, dredging, tailings transport, wastewater, and high-solids industrial applications where field conditions can differ substantially from laboratory test conditions.
Questions to Ask Before Trusting Any Pump Curve
Before using a published pump curve to predict field performance, buyers, engineers, and project managers should ask:
- What is the actual slurry density?
- What solids percentage will the system handle by weight and by volume?
- What is the particle size distribution?
- How long is the pipeline?
- What elevation changes exist?
- How many bends, valves, fittings, and reducers are in the system?
- What transport velocity is required to prevent settling?
- How much wear is expected over time?
- Has a system curve been developed?
- Have slurry correction factors been applied?
- Does the selected pump have enough solids handling capability for the actual material?
The answers to these questions often reveal more about expected slurry performance than the pump curve alone.
How EDDY Pump Looks Beyond the Curve
For severe-duty slurry applications, pump selection should start with the curve but should not end there. EDDY Pump evaluates the full operating environment, including slurry density, solids concentration, particle size, pipeline distance, elevation changes, wear expectations, and clogging risk.
This matters because high-solids slurry systems are rarely stable, clean-water applications. Material conditions can change throughout operation. Solids may settle. Larger particles or debris may enter the system. Pipeline friction can increase over time. Wear can gradually shift actual performance away from original curve assumptions.
EDDY Pump’s non-clog design, recessed rotor, and open volute geometry are designed for abrasive, high-solids, and viscous materials where conventional tight-tolerance pump designs may experience more clogging and wear. In these applications, long-term performance depends not only on the published curve, but also on how well the pump design handles the material and operating conditions.
The practical takeaway is simple: slurry pump selection is not just a pump curve review. It is a system review.
Looking Beyond the Curve: Evaluating Real Pump Performance in Slurry Systems
Pump curves remain essential for pump selection because they provide information on flow rate, head, efficiency, power requirements, and operating limits. However, most pump curves are based on clean-water testing, which means they do not fully reflect real slurry applications.
Once solids are introduced, slurry density, solids concentration, particle size distribution, transport velocity requirements, pipeline conditions, and wear can significantly influence actual performance. A pump may meet its published performance specifications and still underperform if the system requires more energy than expected.
Effective slurry pump selection requires evaluating the entire pumping system, including slurry characteristics, pipeline layout, system resistance, wear expectations, and long-term operating conditions. This helps improve performance predictability, reduce costly surprises, and ensure the pump, slurry, and system work together as intended.
Need Help Reviewing a Slurry Pump Curve?
Before selecting a pump based on a published curve, make sure the full system has been reviewed. EDDY Pump can help evaluate slurry characteristics, solids concentration, particle size, pipeline distance, elevation changes, and operating conditions to determine whether the pump, slurry, and system are properly matched.
If you are comparing pump curves, troubleshooting lower-than-expected flow, or planning a new slurry transfer system, talk to the EDDY Pump team before relying on curve data alone.
Frequently Asked Questions About Slurry Pump Curves
1. Why is my slurry pump delivering less flow than the pump curve indicates?
Pump curves are typically based on clean-water testing. If the actual application involves higher slurry density, increased solids concentration, larger particles, longer pipelines, additional fittings, or greater friction losses than expected, the pump may operate at a different point than shown on the published curve.
2. Can I use a water-based pump curve to select a slurry pump?
A water-based pump curve is a useful starting point, but it should not be the only basis for slurry pump selection. Slurry characteristics and system conditions often require correction factors, hydraulic analysis, and system curve evaluation to estimate real-world performance.
3. What is the difference between a pump curve and a system curve?
A pump curve shows what the pump can produce at different operating conditions. A system curve shows the head and flow requirements of the pipeline system. Actual performance occurs where the pump curve and system curve intersect.
4. Which slurry property has the biggest impact on pump performance?
There is no single factor that affects every application equally, but slurry density and solids concentration are often among the most influential variables. They affect power requirements, friction losses, efficiency, and the energy needed to transport material through the system.
5. Why does power consumption increase when pumping slurry instead of water?
Slurries are heavier and more complex to transport than water. As density and solids content increase, the pump must use more energy to move material through the pipeline system. This often results in higher power consumption than clean-water curve values suggest.
6. What information should I gather before selecting a slurry pump?
At a minimum, gather slurry density, solids concentration, particle size distribution, required flow rate, pipeline length, pipe diameter, elevation changes, expected wear conditions, and overall system configuration.
7. Why does pump performance change over time in slurry service?
Abrasive slurry can wear impellers, volutes, liners, internal clearances, and pipelines. As components wear and pipe surfaces become rougher, actual performance can shift away from the original curve conditions.
8. How can EDDY Pump help with slurry pump curve evaluation?
EDDY Pump can review the pump, slurry characteristics, pipeline layout, system resistance, solids handling requirements, and application conditions together so the pump is evaluated as part of the full slurry system.